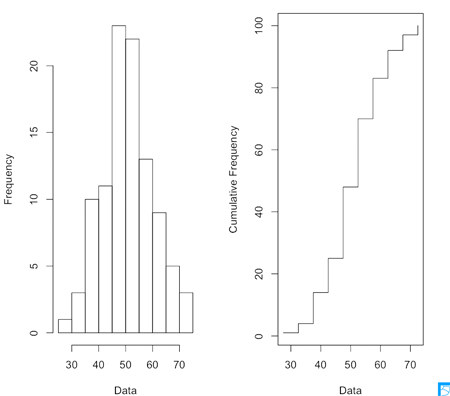
Rによる度数分布と累積度数分布の描画.par(mfrow = c(1, 2)) の行は,1行2列のプロットレイアウトを作成し,度数分布と累積度数分布を並べて表示するためのもの.
# ランダムなデータの生成
# 再現性のための乱数シードの設定
set.seed(123)
# 平均50、標準偏差10の正規分布から100個のランダムなデータを生成
data <- rnorm(100, mean = 50, sd = 10)

# ヒストグラムの作成(度数分布)
# ヒストグラムのデータを取得
hist_data <- hist(data, breaks = 10, plot = FALSE)

# ビンの中心値を取得
bin_centers <- hist_data$breaks[-1] - diff(hist_data$breaks) / 2

# 累積度数分布の作成
# ビンごとの度数を計算し、累積度数を計算
cumulative <- cumsum(hist_data$counts)

# 1行2列のレイアウトに設定
par(mfrow = c(1, 2))
hist(data, breaks = 10, main = "Histogram - Frequency Distribution", xlab = "Data", ylab = "Frequency")
plot(bin_centers, cumulative, type = "s", main = "Cumulative Frequency Distribution", xlab = "Data", ylab = "Cumulative Frequency")

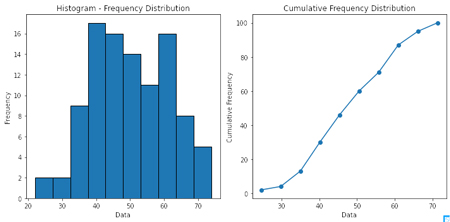
Pythonで描画する.NumPy を使用してランダムなデータを生成し, matplotlibを使用してヒストグラム[度数分布]と累積度数分布をプロットする.
import numpy as np
import matplotlib.pyplot as plt

# ランダムなデータの生成
# 再現性のための乱数シードの設定
np.random.seed(123)
# 平均50、標準偏差10の正規分布から100個のランダムなデータを生成
data = np.random.normal(loc=50, scale=10, size=100)

# ヒストグラムの作成(度数分布)
plt.figure(figsize=(10, 5))
plt.subplot(1, 2, 1)
plt.hist(data, bins=10, edgecolor='black')
plt.title('Histogram - Frequency Distribution')
plt.xlabel('Data')
plt.ylabel('Frequency')

# 累積度数分布の作成
hist, bins = np.histogram(data, bins=10)
cumulative = np.cumsum(hist)

# ビンの中心値を取得
bin_centers = (bins[:-1] + bins[1:]) / 2

# 累積度数分布のプロット
plt.subplot(1, 2, 2)
plt.plot(bin_centers, cumulative, marker='o', linestyle='-')
plt.title('Cumulative Frequency Distribution')
plt.xlabel('Data')
plt.ylabel('Cumulative Frequency')

plt.tight_layout()
plt.show()

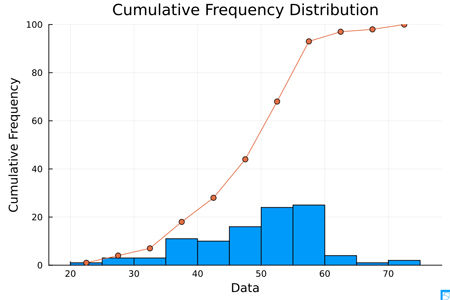
次に,Juliaで描画する.ここで,Randomモジュールをインポートすることにより,Random.seed! 関数を使用して乱数シードを設定している.さらに,StatsBaseパッケージを使用して,ヒストグラムを生成するための fit 関数を呼び出す.なお,plot! 関数を使用して累積度数分布を同じプロットに追加している.
using Plots
# Randomモジュールをインポート
using Random
# StatsBaseパッケージをインポート
using StatsBase

# ランダムなデータの生成
# 再現性のための乱数シードの設定
Random.seed!(123)
# 平均50、標準偏差10の正規分布から100個のランダムなデータを生成
data = randn(100) * 10 .+ 50

# ヒストグラムの作成(度数分布)
plt_hist = histogram(data, bins=10, xlabel="Data", ylabel="Frequency", title="Histogram - Frequency Distribution", legend=false)


# 累積度数分布の作成
hist = fit(Histogram, data, nbins=10)
cumulative = cumsum(hist.weights)

# ビンの中心値を取得
bin_centers = midpoints(hist.edges[1])

# 累積度数分布のプロット
plot!(bin_centers, cumulative, marker=:circle, linestyle=:solid, xlabel="Data", ylabel="Cumulative Frequency", title="Cumulative Frequency Distribution", legend=false)

Mathematics is the language with which God has written the universe.