Rでローレンツ曲線を描く.普通に描くと,
# データの準備(例としてランダムなデータを使用)
# 乱数シードの設定(再現性のため)
set.seed(123)
# 0から1までの一様分布から1000個のランダムなデータを生成し、ソート
data <- sort(runif(1000))

# データ数
n <- length(data)

# ローレンツ曲線の計算
# 累積データの割合
cumulative_data <- cumsum(data) / sum(data)
# 累積割合
cumulative_fraction <- c(0, 1:n) / n

# ローレンツ曲線のプロット
plot(cumulative_fraction, c(0, cumulative_data), type = "l", col = "blue", lwd = 2,
 xlab = "Fraction of Population", ylab = "Fraction of Income or Wealth",
 main = "Lorenz Curve", xlim = c(0, 1), ylim = c(0, 1))
# 45度線のプロット
abline(0, 1, col = "red", lwd = 2, lty = 2)
legend("topleft", legend = c("Lorenz Curve", "Equality Line"),
 col = c("blue", "red"), lwd = 2, lty = c(1, 2))
こうすると,一見,うまく描けるような気がする.しかし,アウトプットされたグラフは以下ののように原点が (0,0) ではない.
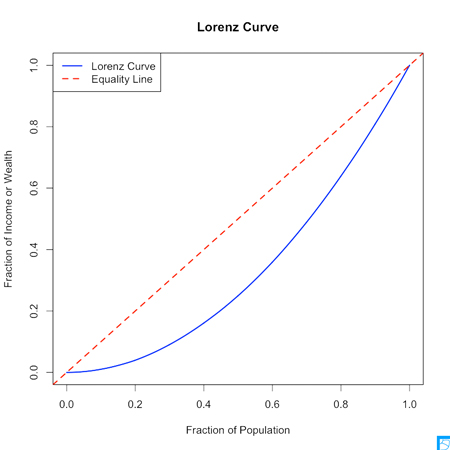
グラフの原点を (0,0) ,終わりを (1,1) とする,つまり,軸の範囲を指定した値きっかりとするには, xaxs と yaxs オプション に "i" を指定してする必要がある.
# ローレンツ曲線のプロット
plot(c(0, cumulative_fraction), c(0, cumulative_data), type = "l", col = "blue", lwd = 2,
 xlab = "Fraction of Population", ylab = "Fraction of Income or Wealth",
 main = "Lorenz Curve", xlim = c(0, 1), ylim = c(0, 1),
 xaxs = "i", yaxs = "i")
とコードを変更すると問題なく表示される.
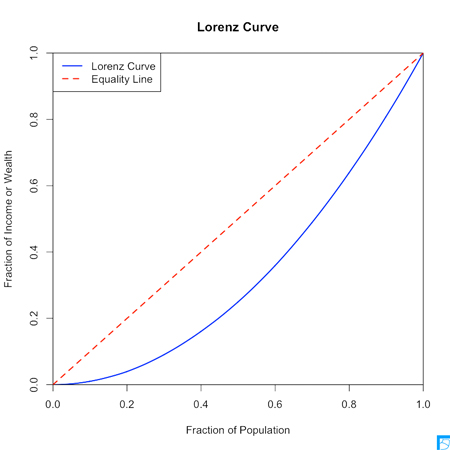
次に,Pythonを使って,ローレンツ曲線を描く.
import numpy as np
import matplotlib.pyplot as plt

# データの準備(例としてランダムなデータを使用)
# 乱数シードの設定(再現性のため)
np.random.seed(123)
# 0から1までの一様分布から1000個のランダムなデータを生成し、ソート
data = np.sort(np.random.rand(1000))

# データ数
n = len(data)

# ローレンツ曲線の計算
# 累積データの割合
cumulative_data = np.cumsum(data) / np.sum(data)
# 累積割合
cumulative_fraction = np.arange(1, n + 1) / n

# ローレンツ曲線のプロット
plt.plot(np.insert(cumulative_fraction, 0, 0), np.insert(cumulative_data, 0, 0),
 color='blue', linewidth=2)
# 原点から(1,1)までの45度線のプロット
plt.plot([0, 1], [0, 1], color='red', linewidth=2, linestyle='--')
plt.xlabel('Fraction of Population')
plt.ylabel('Fraction of Income or Wealth')
plt.title('Lorenz Curve')
plt.legend(['Lorenz Curve', 'Equality Line'], loc='upper left')
plt.xlim(0, 1)
plt.ylim(0, 1)
plt.grid(True)
plt.show()
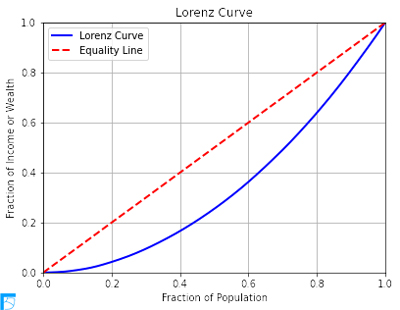
次に,Juliaで描く.
using Random
using Plots

# データの準備(例としてランダムなデータを使用)
# 乱数シードの設定(再現性のため)
Random.seed!(123)
# 0から1までの一様分布から1000個のランダムなデータを生成し、ソート
data = sort(rand(1000))

# データ数
n = length(data)

# ローレンツ曲線の計算
# 累積データの割合
cumulative_data = cumsum(data) / sum(data)
# 累積割合
cumulative_fraction = (1:n) ./ n

# ローレンツ曲線のプロット
plot(cumulative_fraction, cumulative_data, color=:blue,
 linewidth=2, label="Lorenz Curve", xlabel="Fraction of Population",
 ylabel="Fraction of Income or Wealth", title="Lorenz Curve")
plot!([0, 1], [0, 1], color=:red, linestyle=:dash,
 linewidth=2, label="Equality Line")
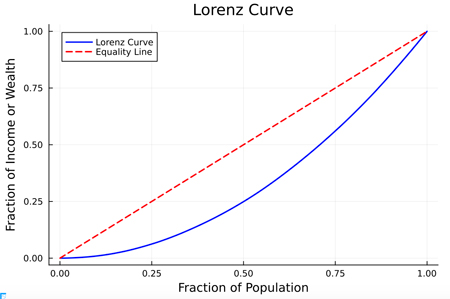
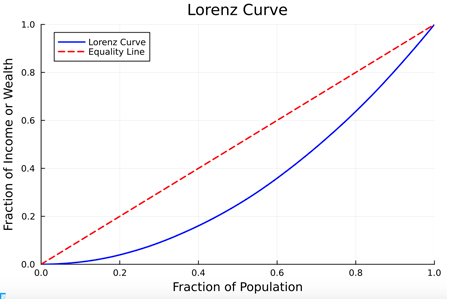
Rの時と同じくグラフの原点が (0,0) となっていない.原点を,きっちり (0,0) とするためには,最後に以下のコードを付け加える.
# 原点を明示的に設定
xlims!(0, 1)
ylims!(0, 1)
Mathematics is the language with which God has written the universe.